
Find your fit
Who Crunchr is for.
A way to tell, in a couple of minutes, whether Crunchr matches your organisation, your workforce complexity, and your role.







the catalog
We’ll take anything you throw at us.
More than a decade of aggregating data from 150+ systems (and growing). Custom data sources are also welcome.
Mid-market to enterprise
For organisations with 1,000+ employees, where a single percent of change is already a big number.
Multi-country workforces
People across borders, currencies and labour laws, reported as one.
Multiple HR systems
An HRIS here, payroll there, an ATS somewhere else. Crunchr ties them together.
Complex reporting structures
Deep hierarchies, matrixed teams, frequent reorgs. The model keeps up.
Workforce planning maturity
Teams moving from annual headcount spreadsheets to live scenario planning.
Executive reporting
A board and a CFO who expect workforce numbers as solid as the financials.
A STRONG fit
And who it isn’t for.
The fastest way to trust a fit is to be straight about where there isn’t one. Crunchr is a deliberate choice for some organisations and the wrong one for others. Here’s the direct version.
A strong fit
- 1,000+ employees, spread across countries or systems
- A people analytics owner working in spreadsheets or Power BI
- Board, business and Finance need answers faster
- Need greater consistency across workforce reporting
- Expected to deliver more self-service insights this quarter
Sounds like you?
Probably not, yet
- Fewer than 500 employees
- No core HR system yet
- HR focused on service delivery
- No owner for people analytics, total rewards or HR operations
Not sure yet?
By industry
Used across many industries.
Crunchr works for almost any organisation with more than 1,000 employees, whatever the sector. What changes from one industry to the next is the questions people ask first. Pick an industry to see the ones it tends to bring, and the numbers Crunchr puts against them.
Manufacturing & Logistics
Common workforce questions:
- Turnover by plant: where, and why there?
- Retirement risk: who walks out the door in the next five years?
- Overtime concentration across sites and shifts
- Skills concentration and single points of failure
- Span of control on the shop floor
A sample read, in Crunchr
Financial & Professional Services
Common workforce questions:
- Where are we losing high performers?
- Is compensation competitive at every level?
- How fast, and how fairly, are people promoted?
- Billable utilisation against headcount cost
A sample read, in Crunchr
Retail & Consumer
Common workforce questions:
- Store-level turnover and time-to-fill
- Seasonal staffing against demand
- Frontline engagement by region
- First-90-day attrition
A sample read, in Crunchr
Technology & Software
Common workforce questions:
- Engineering attrition and flight risk
- Are we paying market for scarce skills?
- Span of control across squads
- Where are the skills gaps for the roadmap?
A sample read, in Crunchr
Healthcare & Life Sciences
Common workforce questions:
- Clinical staffing ratios by unit and shift
- Agency and contingent spend over time
- Credential and licence expiry risk
- Burnout and overtime signals
- Turnover of critical clinical roles
A sample read, in Crunchr
Public Sector
Common workforce questions:
- Workforce ageing and retirement cliffs
- Succession in critical functions
- Transparent and equitable pay
- Span of control across departments
- Time to hire for hard to fill roles
A sample read, in Crunchr
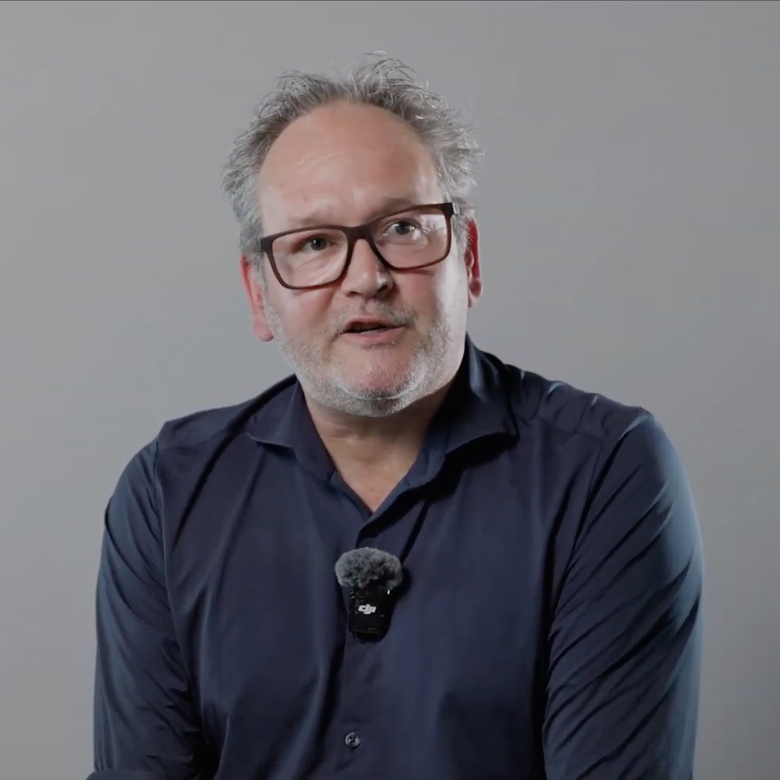

“Every question somebody asks, we can answer it on the spot. And we are able to influence without authority based on facts and figures.”
Location
Netherlands
Industry
Food
Employees
4,600+
Implementation
4 weeks
Every seat at the table
One platform, ready for
the whole team.
People data isn’t just the analytics team’s job any more. The CHRO, the HRBP, the analyst, the recruiter, the business leader and Finance all bring different questions — and in Crunchr they all land on the same governed numbers, each in the view that fits how they work.
Every role reads the same governed numbers.
Each seat is met in its own language.
The view shifts by role, the data holds.

CHRO
The board-level story.
Are we on track against this year’s HR strategy pillars?
4 of 5 on track
Only the AI-adoption pillar is behind, by roughly one quarter.
Where is workforce cost growing fastest?
Operations
Up +6.2% year-on-year — the fastest-rising of all functions.
What’s the board-level story this quarter?
€4.1M over headcount plan
92% of the people cost overspend sits in Operations, not company-wide.

HRBP
Team risk, in context.
Which of my teams are at risk right now?
3 of 14 teams
Predicted attrition above 20% in Field Sales, Support and Commercial Ops.
How does my business unit compare to the company?
+2.4 points
Attrition above the company average, internal moves below it.
Is retention improving in the teams we acted on?
Down 3.1 points
Add sAttrition in the three flagged teams, six months after intervention.upporting detail.

HR Analytics
One definition, served to everyone.
Can I trust this number across every system?
One definition
Headcount reconciled across HRIS, payroll and ATS, and version-controlled.
How do I stop being the ad-hoc dashboard factory?
64% fewer requests
Governed self-service absorbs the routine reporting asks.
What’s actually driving this trend?
Tenure, not pay
Driver analysis puts the 0–18 month cohort ahead of compensation.

Strategic Workforce Planner
The plan Finance signs off.
What does the strategy actually require in headcount?
+312 FTE
Weighted to Engineering and Data, phased across four quarters.
What happens under each scenario?
Three scenarios
Base, stretch and hiring freeze, run against today’s live workforce.
Where will supply fall short of demand?
Data engineering
Demand outruns internal supply by 41 roles next year.

Recruitment Manager
Hiring that still holds up at 24 months.
Which hiring sources produce people who stay?
Referrals
Referred hires stay 1.8 times longer than agency hires at 24 months.
Where is time-to-fill hurting the business?
68 days
Engineering roles run 23 days past target, holding two projects.
How are my recruiters performing at different stages?
Screening loses most
Drop-out runs 79.6% at screening, 59.3% at HR intake, 34.8% at manager interview and 25.0% at assessment.

CFO
Workforce cost, reconciled.
Is workforce cost as auditable as the rest of the P&L?
One source
Every cost line traces back to a reconciled headcount definition.
What’s the cost impact of this plan?
€18.4M
Full-year cost of the base plan, on-costs and attrition included.
Can HR and I finally work from one number?
Monthly close
HR and Finance headcount agree to the person, every period.
Security & deployment
Enterprise-ready, wherever you operate.
SOC 2 Type II
Audited annually
GDPR-native
By design, not by patch
Enterprise-ready
SSO, role-based access, audit trails
Global deployments
Regional data residency on request
People Analytics Platform
See Crunchr in action
A 5-minute tour. No demo call required.